
03/11/2026
Clocking It: The Political Rundown — Halfway Clocked
The American Dream has always been sold as a promise. Work hard, play by the rules, and the market will reward you with a life measurably better than the one your parents had. A home of your own. A retirement that doesn’t depend on your next paycheck. A ladder, not just a floor.
But promises require infrastructure. And the infrastructure that once supported upward mobility, affordable housing, wage growth that tracks productivity, a tax code that redistributes rather than concentrates, has been quietly dismantled, piece by piece, over decades.
The question moving through this week’s political and cultural atmosphere is no longer abstract. It is urgent, personal, and generational: Does the American Dream still exist?
The answer, as we will explore across two editions of Clocking It: The Political Rundown, is not simple. But the data driving that answer is unmistakable. And this week, Halfway Clocked lays the foundation: the numbers, the trends, and the accumulating weight of a system that has stopped delivering for most of the people living inside it.
The Housing Gap: When the Ladder Disappears
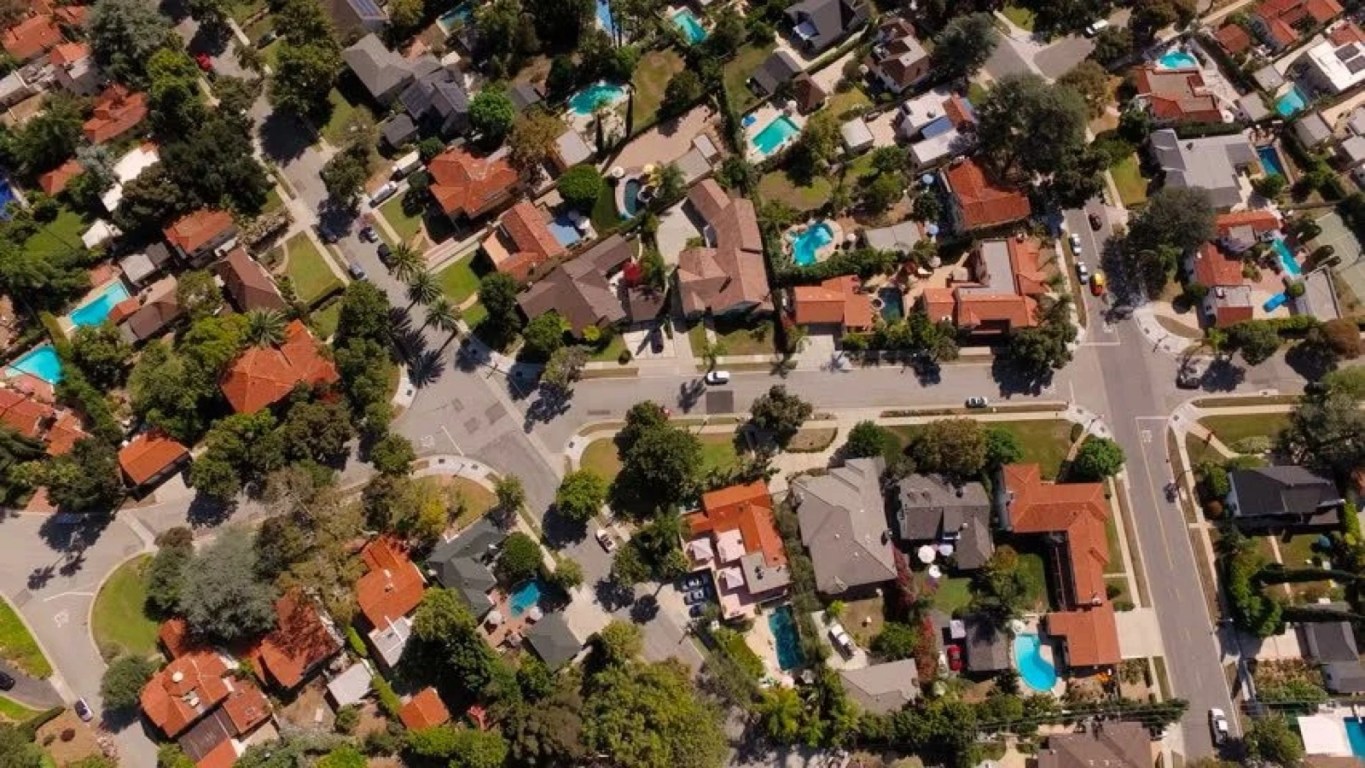
The most visible measure of the American Dream has always been homeownership. A place of your own. Equity. Stability. An asset that builds wealth while you sleep.
For generations of Americans, that worked. In 1985, the median home cost roughly $82,800, and the median household earned about $23,620. The math was manageable: a home cost 3.5 times annual income. By 1990, that ratio had crept to 4.3. By 2005, it hit 5.3 before the housing crash temporarily reset expectations.
Today, the numbers tell a different story entirely. According to data from the Federal Reserve Bank of St. Louis and Motio Research, the median household income in 2025 stands at approximately $83,730, a 255% increase since 1985. But median home prices have surged more than 415% over the same period, reaching $426,800. That leaves the price-to-income ratio at 5.1 nationally, and far higher in coastal markets. In Los Angeles, a home now costs 12.5 times annual income. In San Jose, 10.5 times. In New York, 9.8 times.
This is not a market fluctuation. This is structural drift.
The consequences are showing up in generational data that should alarm anyone who believes in upward mobility. The number of first-time homebuyers in the United States has collapsed from nearly 3.2 million in 2004 to just 1.14 million by late 2024, according to the National Association of Realtors. The median age of first-time buyers has climbed from 29 in 1981 to 38 in 2024, a nine-year shift that represents an entire decade of delayed stability.
And for many, delay has become abandonment. A Bankrate survey found that one in six aspiring homebuyers have simply given up on the idea that they will ever own a home. Among millennials, that figure rises to 22%, the highest of any generation.
The Generational Weight: What Millennials and Gen Z Are Carrying
It is worth pausing on that number. Twenty-two percent of millennials, more than one in five, have stopped believing they will ever own a home. Not postponed. Not deferred. Given up.
This is the generation that came of age during the 2008 financial crisis, watching their parents lose homes and retirement savings. This is the generation that entered the workforce during the slowest wage recovery in modern history. This is the generation that has been told, repeatedly, that if they just work harder, the market will eventually reward them.
The market has not kept its end of the bargain.
According to data compiled by Moneywise, millennials have endured two “once in a lifetime” economic catastrophes before reaching midlife: the Great Recession and the COVID-19 pandemic. Each event reset the financial clock. Each event pushed homeownership further out of reach. And each event occurred through no fault of their own.
For Gen Z, the frustration is taking a different form. A Credit One Bank survey conducted in December 2025 found that 31% of Gen Z respondents define financial success not as accumulation, but as having flexible work and control over their time. The ambition is not to own more, but to owe less. Not to climb higher, but to feel secure where they stand.
That same survey found that 65% of Gen Z respondents support rent caps in their cities, even when warned that such policies could slow new housing development. The preference for immediate affordability over long-term market dynamics speaks to a generation that has stopped believing the long term will ever arrive.
The Redefinition of Success: Debt Freedom as the New Benchmark
Perhaps the most telling data point in the Credit One survey is this: 33% of U.S. consumers now define financial success as being debt-free, regardless of income or assets. Another 34% say their ideal financial future in 2026 is becoming debt-free first, with wealth-building coming later.
The order is revealing. Stability before scale. Relief before growth.
For decades, the American Dream was framed around accumulation: a bigger home, a higher salary, a growing investment account. But when asked to picture their ideal financial situation this year, a third of Americans said they want to clear what they owe before they even think about building what they own.
This is not aspirational wealth. This is aspirational relief.
The psychological weight behind these numbers is visible in other findings from the same survey. Thirty-eight percent of women report that money makes them feel anxious most days, compared to 24% of men. Among those earning under $50,000 annually, 22% say a $1,000 emergency fund would make them feel more secure, a figure so modest it speaks to how far the baseline of security has fallen.
And 21% of lower-income consumers say their debt keeps them up at night.
The Concentration at the Top: How Wealth Became a Ceiling
While younger generations struggle to afford homes and define success as simply being debt-free, the top of the income distribution has been experiencing a very different reality.
According to Federal Reserve data analyzed by multiple outlets, the top 1% of American households now control nearly 32% of the nation’s total wealth, approximately $55 trillion, or almost as much as the bottom 90% combined. That share is the highest it has been since World War II.
The top 0.1%, the richest of the rich, boosted their wealth by 40% in just three years, Fed data show. That is twice the 20% gain experienced by the bottom 90% over the same period.
The main driver? Stock market gains concentrated among those already holding significant financial assets. While affluent households benefit from rising equity markets, middle- and working-class families tend to have their wealth concentrated in their homes, whose values have lagged after a pandemic-era surge. As Moritz Kuhn, an economics professor at the University of Mannheim, put it: “Inequality has become a race between the housing market and the stock market.”
That race is not close.
Moody’s Analytics chief economist Mark Zandi describes the divergence as “structural, fundamental,” not temporary. His analysis finds that total spending for the top 20% of consumers hit multidecade highs last year, while outlays for the remaining 80% fell to new lows. For that 80%, overall spending has failed to outpace inflation over the past six years, leaving living standards flat.
“Their standard of living has not budged since the pandemic hit,” Zandi told CNBC. “It’s just disconcerting.”
The Communities Left Behind: Disparity by Race and Place
The national numbers, stark as they are, obscure deeper disparities that track race and geography.
According to research published in the Russell Sage Foundation Journal, the tax and transfer systems provide substantial redistribution to low-income Black and rural households, narrowing level gaps in any given year. But those same gaps are exacerbated in the upper tail of the distribution. The tax code does not undo the underlying economic forces pulling White and urban incomes apart from Black and rural households in the top half of the distribution.
The result is stagnation in what researchers call “rank positional gaps.” Black households have seen little upward mobility within the White income distribution over the past five decades, with the possible exception of the median. Rural households have made some progress at the low end, but none at the top.
The Economic Policy Institute adds another layer to this picture, documenting how the Southern economic development model, rooted in policies designed to extract labor with minimal compensation, has produced persistently higher poverty rates across the region. In 2023, the South’s poverty rate stood at 12.4%, compared to 11% in the West and 9.8% in the Northeast and Midwest. The South’s child poverty rate of 18% is the highest of any region, with Black children facing a rate of 30.1%, almost three times that of white children.
“Efforts to continue exploiting Black workers have led to racist anti-worker policies that continue to maintain high rates of poverty, low economic mobility, and high levels of inequality for workers of all racial and ethnic backgrounds in most Southern states,” said EPI report author Chandra Childers.
These are not accidental outcomes. They are the accumulated residue of policy choices made over decades.
The Government’s Role: Absent or Complicit
Which brings us to the question of government.
The mechanisms to address concentrated wealth and restricted opportunity exist. The tax code could be more progressive. The safety net could be more robust. Housing policy could prioritize affordability over investor returns. Anti-poverty programs could be expanded rather than constrained.
Instead, the opposite has happened. The share of U.S. gross domestic product going to workers as compensation has fallen to its lowest level in more than 75 years. The tax and transfer systems, while providing some redistribution at the bottom, do nothing to address the structural forces pulling the top away from everyone else.
And in states across the country, the policy conversation has shifted toward taxing the wealthy, not because it has happened, but because it hasn’t. California’s proposed Billionaire Tax Act would impose a one-time 5% levy on residents with a net worth of at least $1 billion. Virginia is considering a 10% bracket on income over $1 million. New York City’s mayor has floated taxes on affluent households to address a $12 billion budget shortfall.
Whether these proposals become law is almost beside the point. Their existence reflects a growing recognition that the system, left to its own devices, will continue to concentrate wealth at the top while leaving everyone else to fall behind.
The Cultural Meaning — Halfway Clocked
Here is what the data actually means.
The American Dream was never just about economics. It was about expectation. It was about the belief that your children would live better than you did, and that your effort would be rewarded with progress, not just survival.
That belief is now statistical.
When one in five millennials has given up on owning a home, the ladder is not just missing rungs. It has been removed. When a third of Americans define success as being debt-free rather than wealthy, the aspiration has shifted from growth to relief. When the top 1% holds nearly one-third of the nation’s wealth while the bottom 90% struggles to keep their living standards flat, the system is not malfunctioning. It is performing exactly as designed.
The question Halfway Clocked leaves hanging is the one readers have been asking all week: If the American Dream is this damaged, can it be repaired? Does it still exist for anyone, anywhere? And if it exists for some but not for many, what does that say about the country that promised it to everyone?
Those answers require a verdict. And that verdict will come in the second part of this examination.
But for now, the snapshot is clear. The architecture of diminishing returns has been built, floor by floor, over decades. The question is whether anyone still has the will to tear it down.
Halfway Clocked. That’s the tea.
Sources
· Credit One Bank. “For One in Three U.S. Consumers, the New American Dream is About Escaping Debt.” January 27, 2026
· Fortune. “Housing costs are so high some Americans are delaying milestones like getting married, having kids and even adopting a pet.” September 24, 2025
· CEIC Data. “United States US: Price to Income Ratio: sa.” 1970–2024
· InvestmentNews. “Fed data highlights deepening wealth divide as blue states target top earners.” February 2, 2026
· RSF: The Russell Sage Foundation Journal of the Social Sciences. “Stalled Progress? Five Decades of Black-White and Rural-Urban Income Gaps.” January 2025
· Waupaca County Post. “Debt-free, flexible, and focused on stability: The money mindset of US consumers in 2026.” February 26, 2026
· Moneywise. “This 1 generation is the most likely to give up on their dream of owning a home.” October 2025
· Visual Capitalist. “Why U.S. Homes Feel Pricier: House Prices vs. Income (1985–2025).” December 2025
· The Business Times. “Rich Americans had a good 2025. Everyone else fell behind.” January 21, 2026
· Economic Policy Institute. “The South’s high poverty rates and low economic mobility are the result of racist, anti-worker policies.” April 3, 2025
About the Author
Andrew Greene is a quality-obsessed, results-driven powerhouse with nearly two decades of experience transforming complexity into clear, actionable solutions. His secret weapon? A mix of analytical sharpness, problem-solving precision and a communication and leadership style that’s equal parts clarity and charisma. From Quality Assurance to political data analysis, you can think of him as the Swiss Army knife of operational excellence, minus the corkscrew (unless it’s a team celebration).